Underwriting Analysis
Motor Carrier Underwriting Analysis
Evaluate transportation risk with confidence.
Carrier Software helps insurance carriers, MGAs, and transportation underwriters evaluate motor carriers faster using transportation-specific intelligence, safety analytics, and operational insights. Identify risk, evaluate submissions, and make more confident underwriting decisions.
Trusted by transportation insurance professionals nationwide.
Better Intelligence Leads to Better Underwriting Decisions
Every underwriting decision starts with accurate intelligence. Carrier Software brings together carrier history, safety performance, inspections, crash data, operational information, and transportation-specific insights in one streamlined workflow. This helps underwriters evaluate risk faster and make more confident decisions.
Screen New Submissions Faster
Quickly identify submissions that need a closer underwriting review.
Evaluate Risk with Confidence
Access transportation-specific intelligence that supports consistent underwriting decisions.
Identify Hidden Risk Indicators
Reveal hidden patterns and relationships before they become underwriting risks.
Reduce Manual Research
Spend less time gathering information and more time making informed underwriting decisions.
01
Screen New Submissions in Minutes
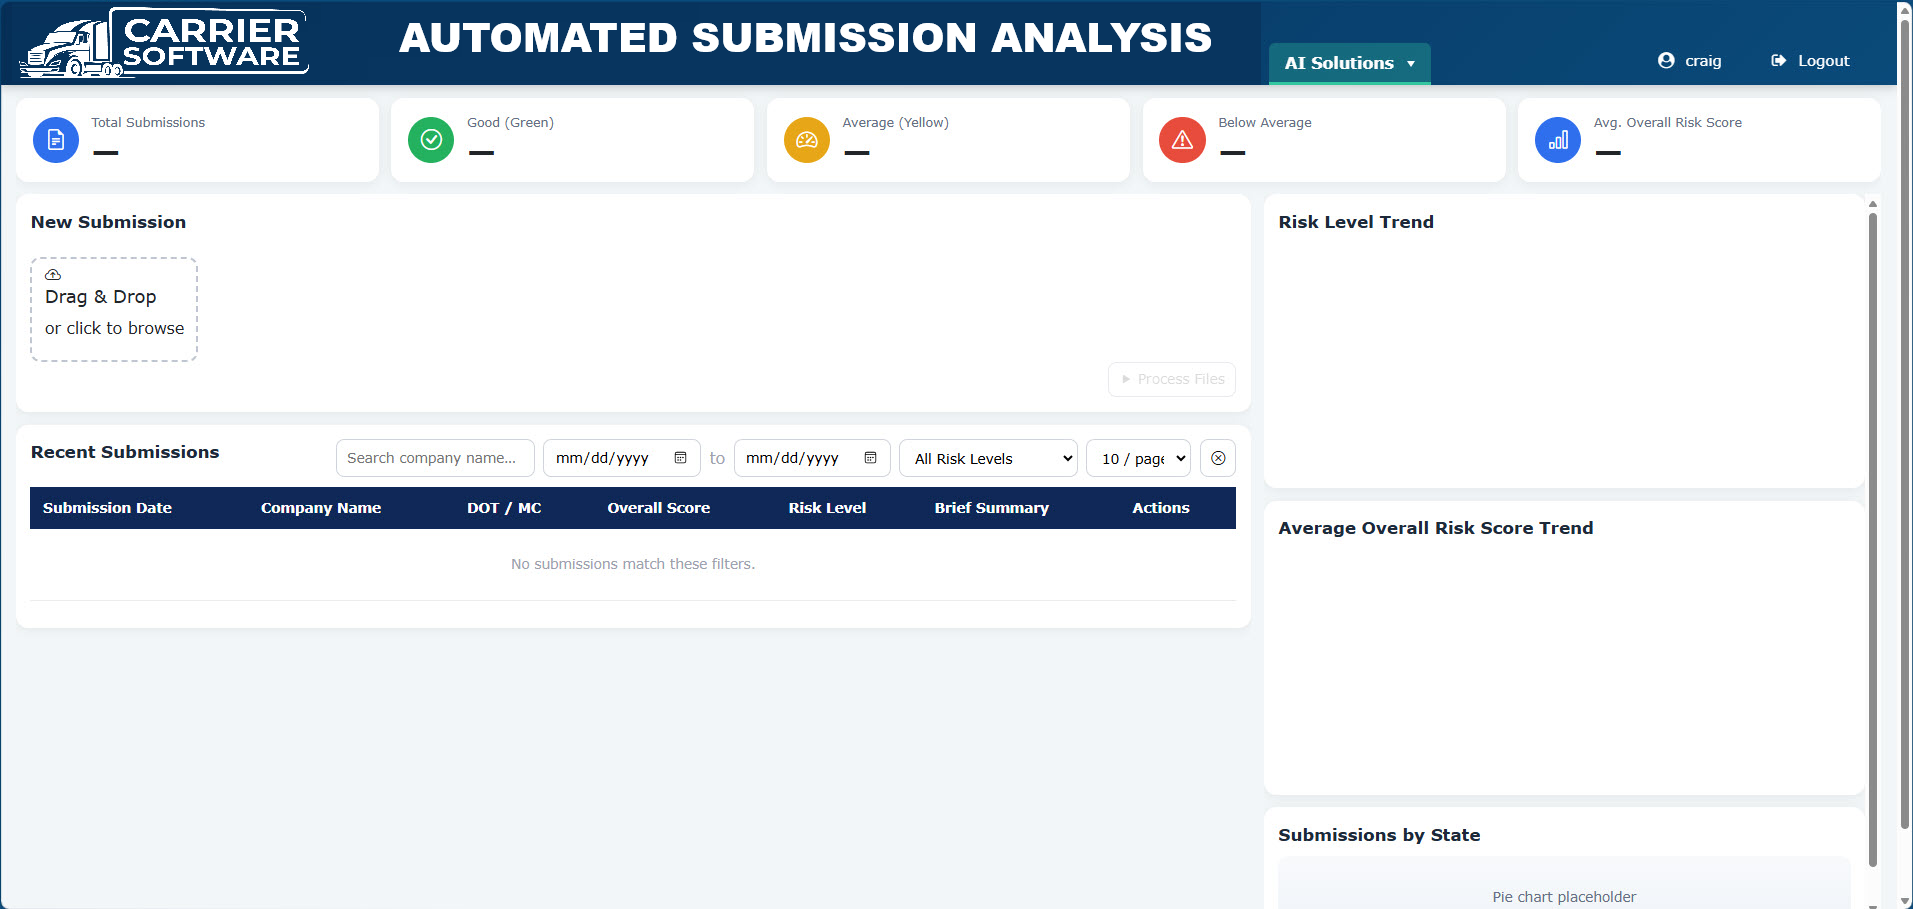
Quickly identify the underwriting indicators that matter most before investing time in a deeper analysis. Review key carrier, safety, and operational information so your team can prioritize submissions and focus on the accounts that need attention.
- Carrier overview
- Safety performance summary
- Key underwriting indicators
- Operational snapshot
- Early risk identification
- Faster submission screening
Powered by Snapshot Underwriting Intelligence
02
Perform a Comprehensive Carrier Analysis
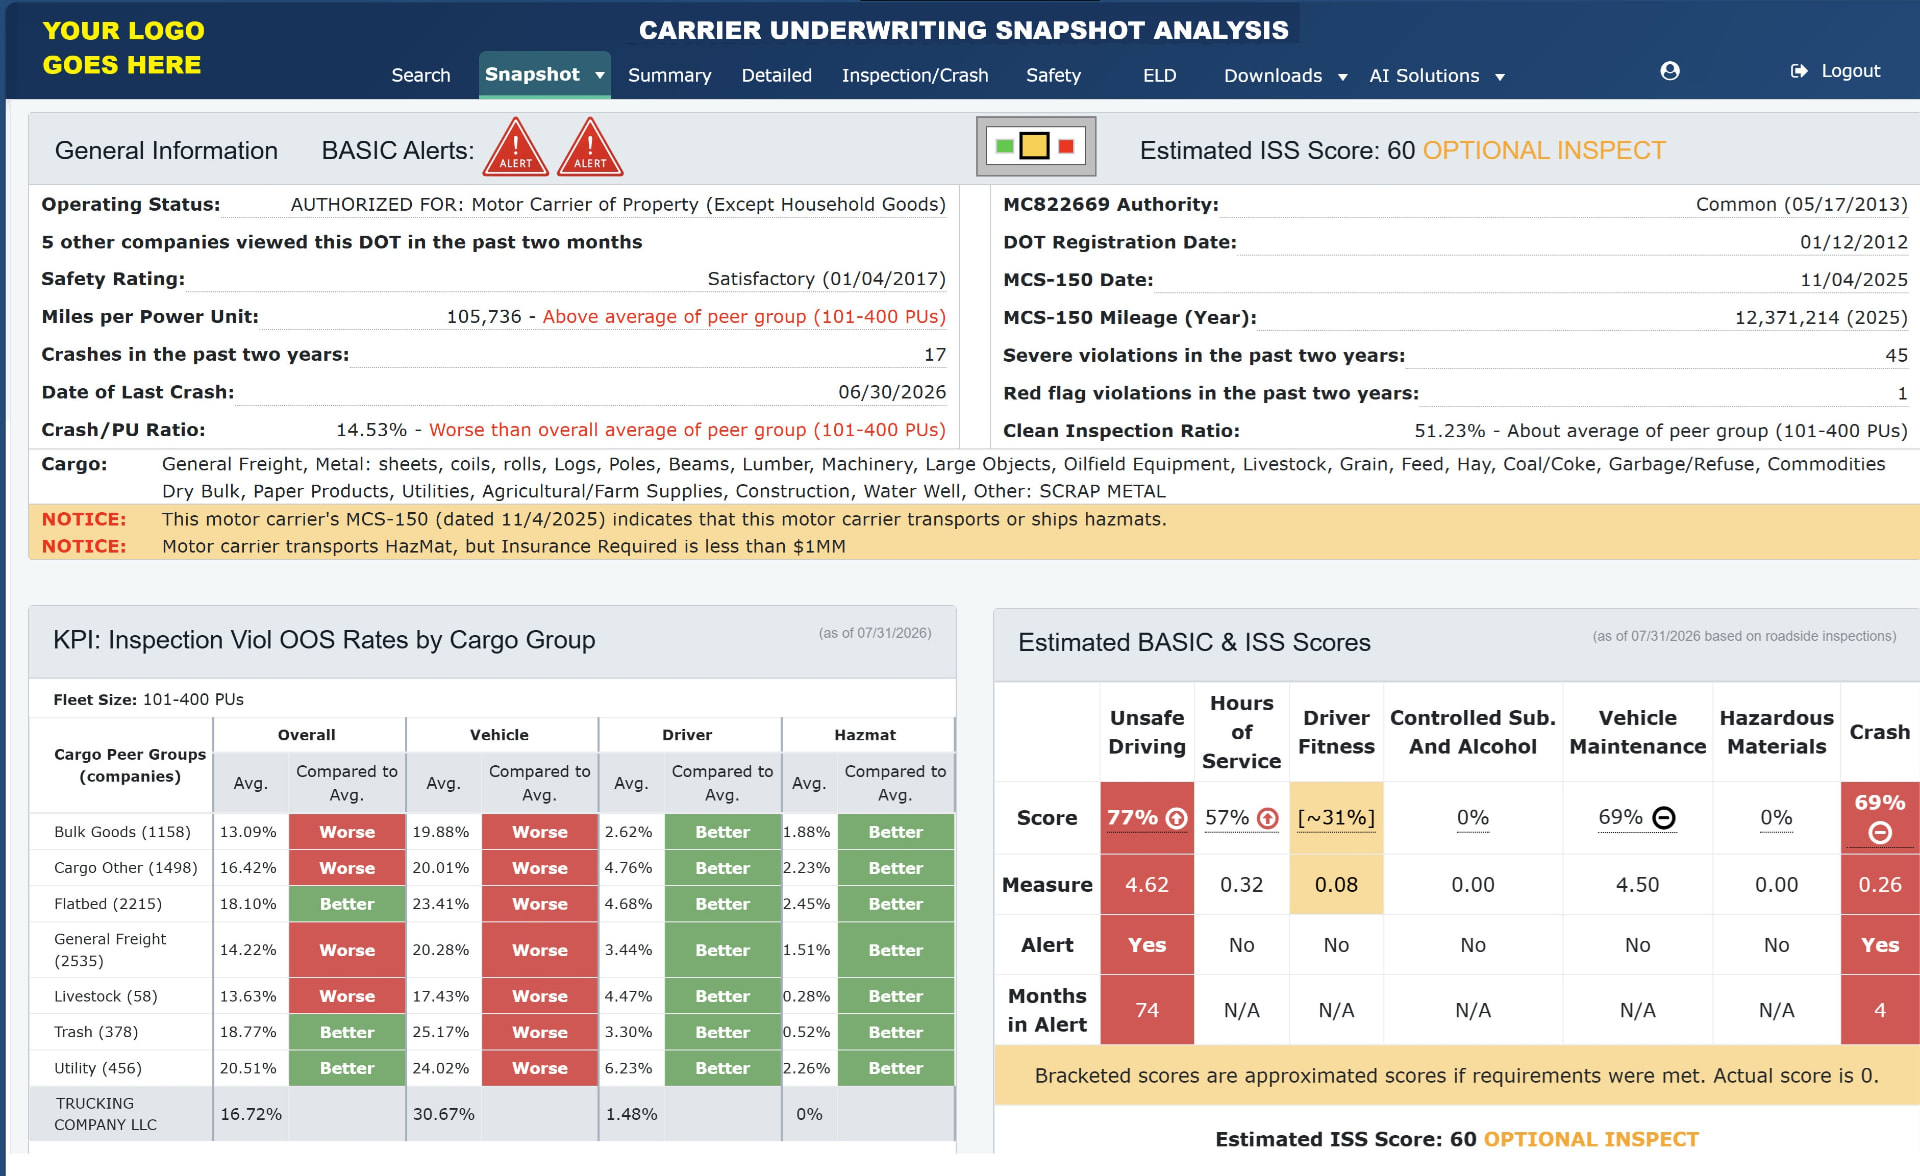
Review a motor carrier’s operational history, safety performance, inspections, crash activity, and other transportation-specific information in one comprehensive analysis. This gives underwriters a clearer view of the carrier’s risk profile before making an underwriting decision.
- Operational history
- Inspection history
- Safety performance
- Crash analysis
- Underwriting intelligence
- Transportation-specific insights
03
Identify Risk Trends Before They Become Problems
See how a carrier's scores have changed over time across Unsafe Driving, Vehicle Maintenance, Hours of Service, and Crash. Historical trends give underwriters additional context so decisions aren't based on a single point-in-time snapshot.
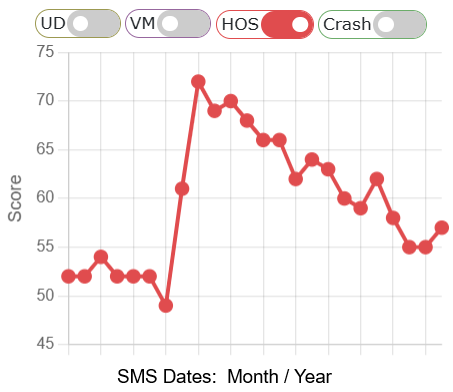
Monitor safety trends
Track carrier performance over time to spot improving or declining patterns.
Identify changing risk patterns
Identify warning signs early and react before they affect an underwriting decision.
Use historical data to better understand carrier performance
Put current performance in context by reviewing how the carrier has changed over time.
04
Compare Carriers Against Similar Fleets
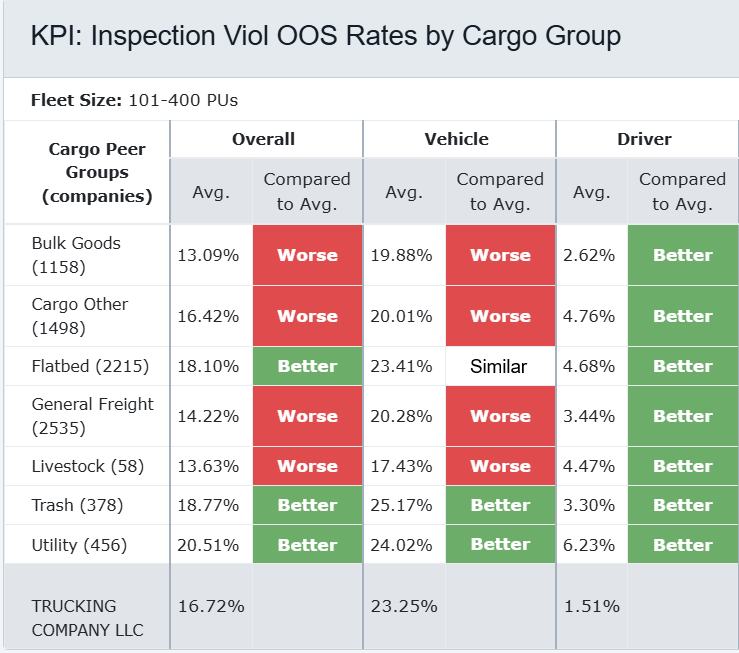
Evaluate a carrier against fleets of comparable size and cargo group. Overall, vehicle, and driver inspection violation and out-of-service rates are compared with peer averages, giving underwriters more relevant context than broad national benchmarks alone.
Compare Peer Fleets
Benchmark carriers against peers of similar size and cargo type for meaningful comparisons.
Evaluate Relative Risk
See where a carrier performs better or worse than average across each BASIC measure.
Improve Underwriting Confidence
Add peer context to every decision so strengths and concerns are clear before you quote.
Powered by Peer Benchmarking
05
Reveal Hidden Carrier Relationships
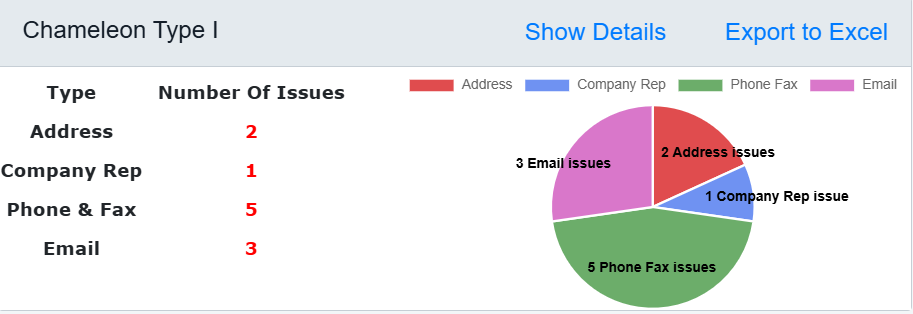
Chameleon surfaces shared information such as addresses, company representatives, phone and fax numbers, and email addresses that may connect a carrier to other entities. These are investigative signals worth a closer look, not conclusions on their own.
Shared Facilities
Identify physical locations linked to multiple carriers.
Shared Contacts
Identify common personnel across multiple carriers.
Shared Phone Numbers
Identify carriers that share phone numbers.
Relationship Intelligence
Surface potential relationships that may warrant further underwriting review.
POWERED BY CHAMELEON ANALYSIS
06
Underwriting Decision Workspace
Carrier Software brings carrier performance, peer comparisons, insurance history, safety data, and other transportation intelligence into one underwriting workspace. This gives underwriters a clearer view of risk so they can evaluate motor carriers faster and make more confident decisions.
Motor Carrier Profile
Midwest Freight Lines, Inc.
Overall Risk Score
Favorable
Composite of safety, crash, inspection, and operational signals
Safety Performance
Above Peer AverageBASIC measures below intervention thresholds
Crash History
Low Frequency2 recordable crashes / 36 months
Inspection Trends
ImprovingOOS rate down 4.2 pts year over year
Peer Benchmark
Top Quartilevs. 41 fleets of similar size and cargo
Insurance Stability
—ConsistentNo lapses in filed coverage history
Fleet Growth
+12% Power UnitsMonitor driver hiring pace
AI Underwriting Summary
Carrier intelligence across DOT registration, safety measures, inspections, crashes, and insurance filings has been consolidated into a single underwriting view.
- Stable operating history across 11 years of authority
- Improving inspection performance over the last four quarters
- Strong peer comparison within similar fleet size and cargo class
- Low crash frequency relative to exposure and mileage
- Consistent insurance history with no filing gaps
Authority
Active
Exposure
Moderate
Trajectory
Improving
Recommendation
Continue Standard Underwriting Review
No adverse indicators requiring escalation. Proceed with standard review and monitor fleet growth at renewal.
- Crash history
- Inspection history
- Violation trends
- Operational performance
- Risk indicators
- Transportation-specific intelligence
Built for Transportation Insurance Professionals
Carrier Software gives transportation insurance professionals the intelligence they need to evaluate motor carrier risk, identify potential issues faster, and make more confident underwriting decisions.
Insurance Carriers
Evaluate motor carrier risk consistently, improve underwriting efficiency, and make more confident decisions across your team.
Managing General Agents (MGAs)
Access detailed carrier intelligence to support consistent underwriting decisions and more effective risk evaluation.
Transportation Underwriters
Reduce manual research, identify risk indicators sooner, and make more confident underwriting decisions.
Customer Results
Trusted by Transportation Insurance Professionals
Decades of transportation industry experience and a platform built around the needs of motor carrier insurance professionals.
2000+
Customers Served
26+
Years Serving the Industry
2.3M+
MOTOR CARRIERS IN THE DATABASE
★★★★★
Customer Satisfaction
FAQ
Underwriting Analysis
Here are answers to common questions about using Carrier Software to evaluate motor carrier risk and support transportation underwriting. To see the platform in action, schedule a live demo with our team.
Get Started
Ready to Evaluate Transportation Risks with Greater Confidence?
See how Carrier Software helps underwriters reduce research time, identify motor carrier risk sooner, and make more confident underwriting decisions.